How Walkable is Eastwood in Nashville, TN?
Buyers competing for homes in Eastwood in Nashville, TN are bidding up: over 41% of homes sold above asking here. The neighborhood's Walk Score of 72 puts it in the "Very Walkable" tier. The area has experienced steady residential growth as East Nashville's popularity spreads along the Gallatin Pike corridor.
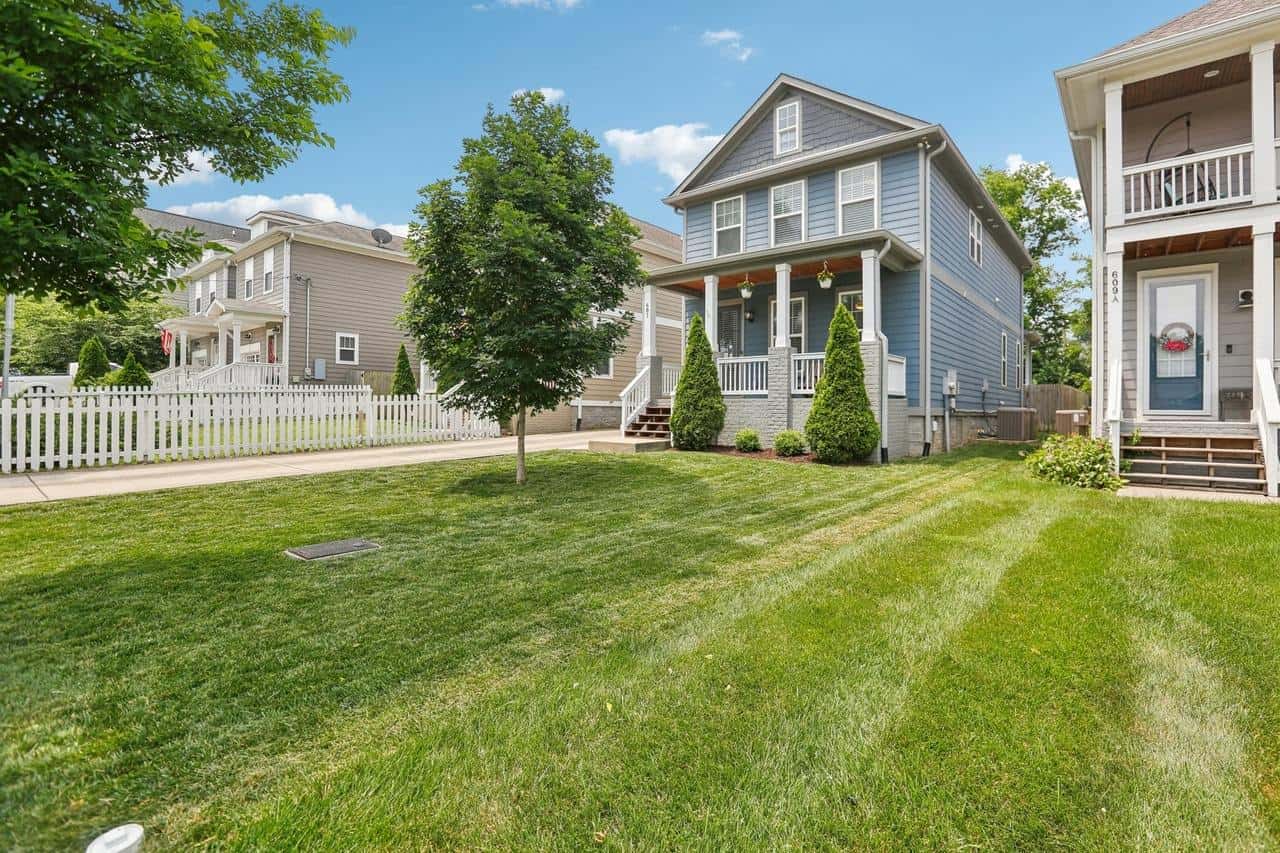
Walkability in the Nashville area
Eastwood's 72 matches Melrose and sits just below Edgefield (73) and Lockeland Springs (73). It well exceeds the Nashville metro average of 29 and the lower-scoring East Nashville options like Inglewood (35) and Shelby Hills (49).
The neighborhood draws walkability from its position along Gallatin Pike's commercial strip and proximity to East Nashville's denser retail areas. The relatively flat terrain and grid streets make cycling a practical option, reflected in the bike score of 52 (Bikeable).
What a Walk Score of 72 means
Eastwood's Walk Score of 72 means most daily errands can be done on foot. Restaurants, coffee shops, and convenience stores along Gallatin Pike are accessible without a car. A full grocery trip may still require driving. The bike score of 52 (Bikeable) and transit score of 37 (Some Transit) provide supplementary options, though neither fully replaces car ownership.
Why do buyers choose Eastwood?
Eastwood is Nashville's most competitive walkable neighborhood right now. Over 41% of homes sold above asking, the highest rate in the Nashville area. The sale-to-list ratio of 100.2% confirms buyers are paying above list price on average. Homes move in a median of 40 days with about 3.4 months of supply, and 44% went pending within two weeks.
At a median of $719,754, Eastwood costs less than Lockeland Springs ($810,723) or Edgefield ($749,744) with essentially the same Walk Score. The intense competition reflects that value gap—buyers recognize Eastwood as the best-priced "Very Walkable" option in East Nashville. Prices are up about 3% year over year, modest compared to some neighbors.
| City/Neighborhood | Walk Score | Bike Score | Transit Score | Median Price | Days on Market |
|---|---|---|---|---|---|
| Eastwood ★ | 72 | 52 | 37 | $719,754 | 40 days |
| Melrose | 72 | 49 | 30 | $969,669 | 84 days |
| Edgefield | 73 | 59 | 45 | $749,744 | 66 days |
| Lockeland Springs | 73 | 50 | 36 | $810,723 | 27 days |
| Germantown | 75 | 72 | 50 | $544,814 | 72 days |
| Edgehill | 66 | 54 | 38 | $904,691 | 75 days |
Limited to neighborhoods with at least 10 home sales in the period.
All data comes from Redfin and represents a three-month rolling average ending July 2026. This article has been generated, in whole or in part, using generative artificial intelligence (AI) technology, with input from Redfin head of economics research Chen Zhao. While efforts have been made to ensure the accuracy and reliability of this information, you should independently verify all data, facts, and citations contained in this article before relying on it for any purpose. This information is not a substitute for advice from a real estate agent, financial advisor, or other licensed professional. Check the Redfin Data Center for additional in-depth housing market data.
Categories
Recent Posts